8.5 KiB
Codebench - Ollama Models Python Benchmark Tool
A Python-based benchmarking tool for testing and comparing different Ollama models on coding tasks. This tool allows you to benchmark multiple Ollama models against common coding problems, measure their performance, and visualize the results.
Features
- Test multiple Ollama models against common coding problems
- Measure performance metrics (tokens/sec, response time)
- Track success rates across different coding challenges
- Support for local and remote Ollama servers
- Automatic model download if not available locally
- Detailed test results and leaderboard generation
- CPU information tracking for benchmarks
Prerequisites
- Python 3.8+
- Ollama server (local or remote)
- Required Python packages (see Installation)
- Together API key (optional, for advanced code analysis)
Installation
- Clone the repository:
git clone https://git.interhacker.space/sammm/codebench.git
cd codebench
- Install required packages:
pip3 install -r requirements.txt
- (Optional) Set up Together API for advanced code analysis:
export TOGETHER_API_KEY='your_api_key_here'
Usage
Basic usage:
python3 main.py
Available options:
python3 main.py --server [local|remote] --model [model_name] --number [count|all] --verbose --plot-only --no-plot --file [results_file] --funcall [model_name|all]
Arguments:
- --server : Choose Ollama server (default: local)
- --model : Test specific model only (will be automatically downloaded if not available locally)
- --number : Number of models to test
- --verbose : Enable detailed output
- --plot-only : Skip benchmarking and just generate graphs from existing results
- --no-plot : Run benchmarking without plotting graphs at the end
- --file : Specify a benchmark results file to use for plotting (only with --plot-only)
- --funcall : Check function calling (tools) compatibility of models. Specify a model name or "all" for all models
Supported Tests
The tool currently tests models on these coding challenges:
- Fibonacci Sequence
- Binary Search
- Palindrome Check
- Anagram Detection
Test Process & Validation
Code Generation
- Each model is prompted with specific coding tasks
- Generated code is extracted from the model's response
- Initial syntax validation is performed
- Code that fails validation is passed to Together API for advanced code analysis
- Code that passes validation is executed and validated with given data and compared to expected results
Test Validation
For each test case:
- Input values are provided to the function
- Output is compared with expected results
- Test results are marked as ✅ (pass) or ❌ (fail)
- The last 3 results of 4are used for metrics
- An online 70b model (via free Together API) : meta-llama/Llama-3.3-70B-Instruct-Turbo-Free is used to give structured explanations for failed code
Metrics
- Success Rate: Percentage of successful test cases
- Tokens per Second (tk/sec): Number of tokens processed per second
- Response Time: Time taken to generate a response
Example test cases:
Fibonacci:
- Input: 6      Expected: 8
- Input: 0      Expected: 0
- Input: -1     Expected: -1

Binary Search:
- Input: ([1,2,3,4,5], 3)    Expected: 2
- Input: ([], 1)             Expected: -1
- Input: ([1], 1)            Expected: 0
Output
Results are saved in the benchmark_results directory with the following naming convention:
[CPU_Model]_[Server_Address].json
Example:
Apple_M1_Pro_localhost_11434.json
Visualizing Results
There are two ways to generate a visual comparison of model performances as a leaderboard:
Option 1: Using main.py (Recommended)
By default, main.py will now automatically generate graphs after benchmarking. You can also use it to just generate graphs without running benchmarks:
# Run benchmarks and generate graphs (default behavior)
python3 main.py

# Test a specific model (will be downloaded automatically if not available locally)
python3 main.py --model llama3

# Skip benchmarking and just generate graphs from the latest results
python3 main.py --plot-only

# Skip benchmarking and generate graphs from a specific results file
python3 main.py --plot-only --file path/to/results.json

# Run benchmarks without generating graphs
python3 main.py --no-plot
The plot will be saved as benchmark_results/model_comparison.png with high resolution (300 DPI).
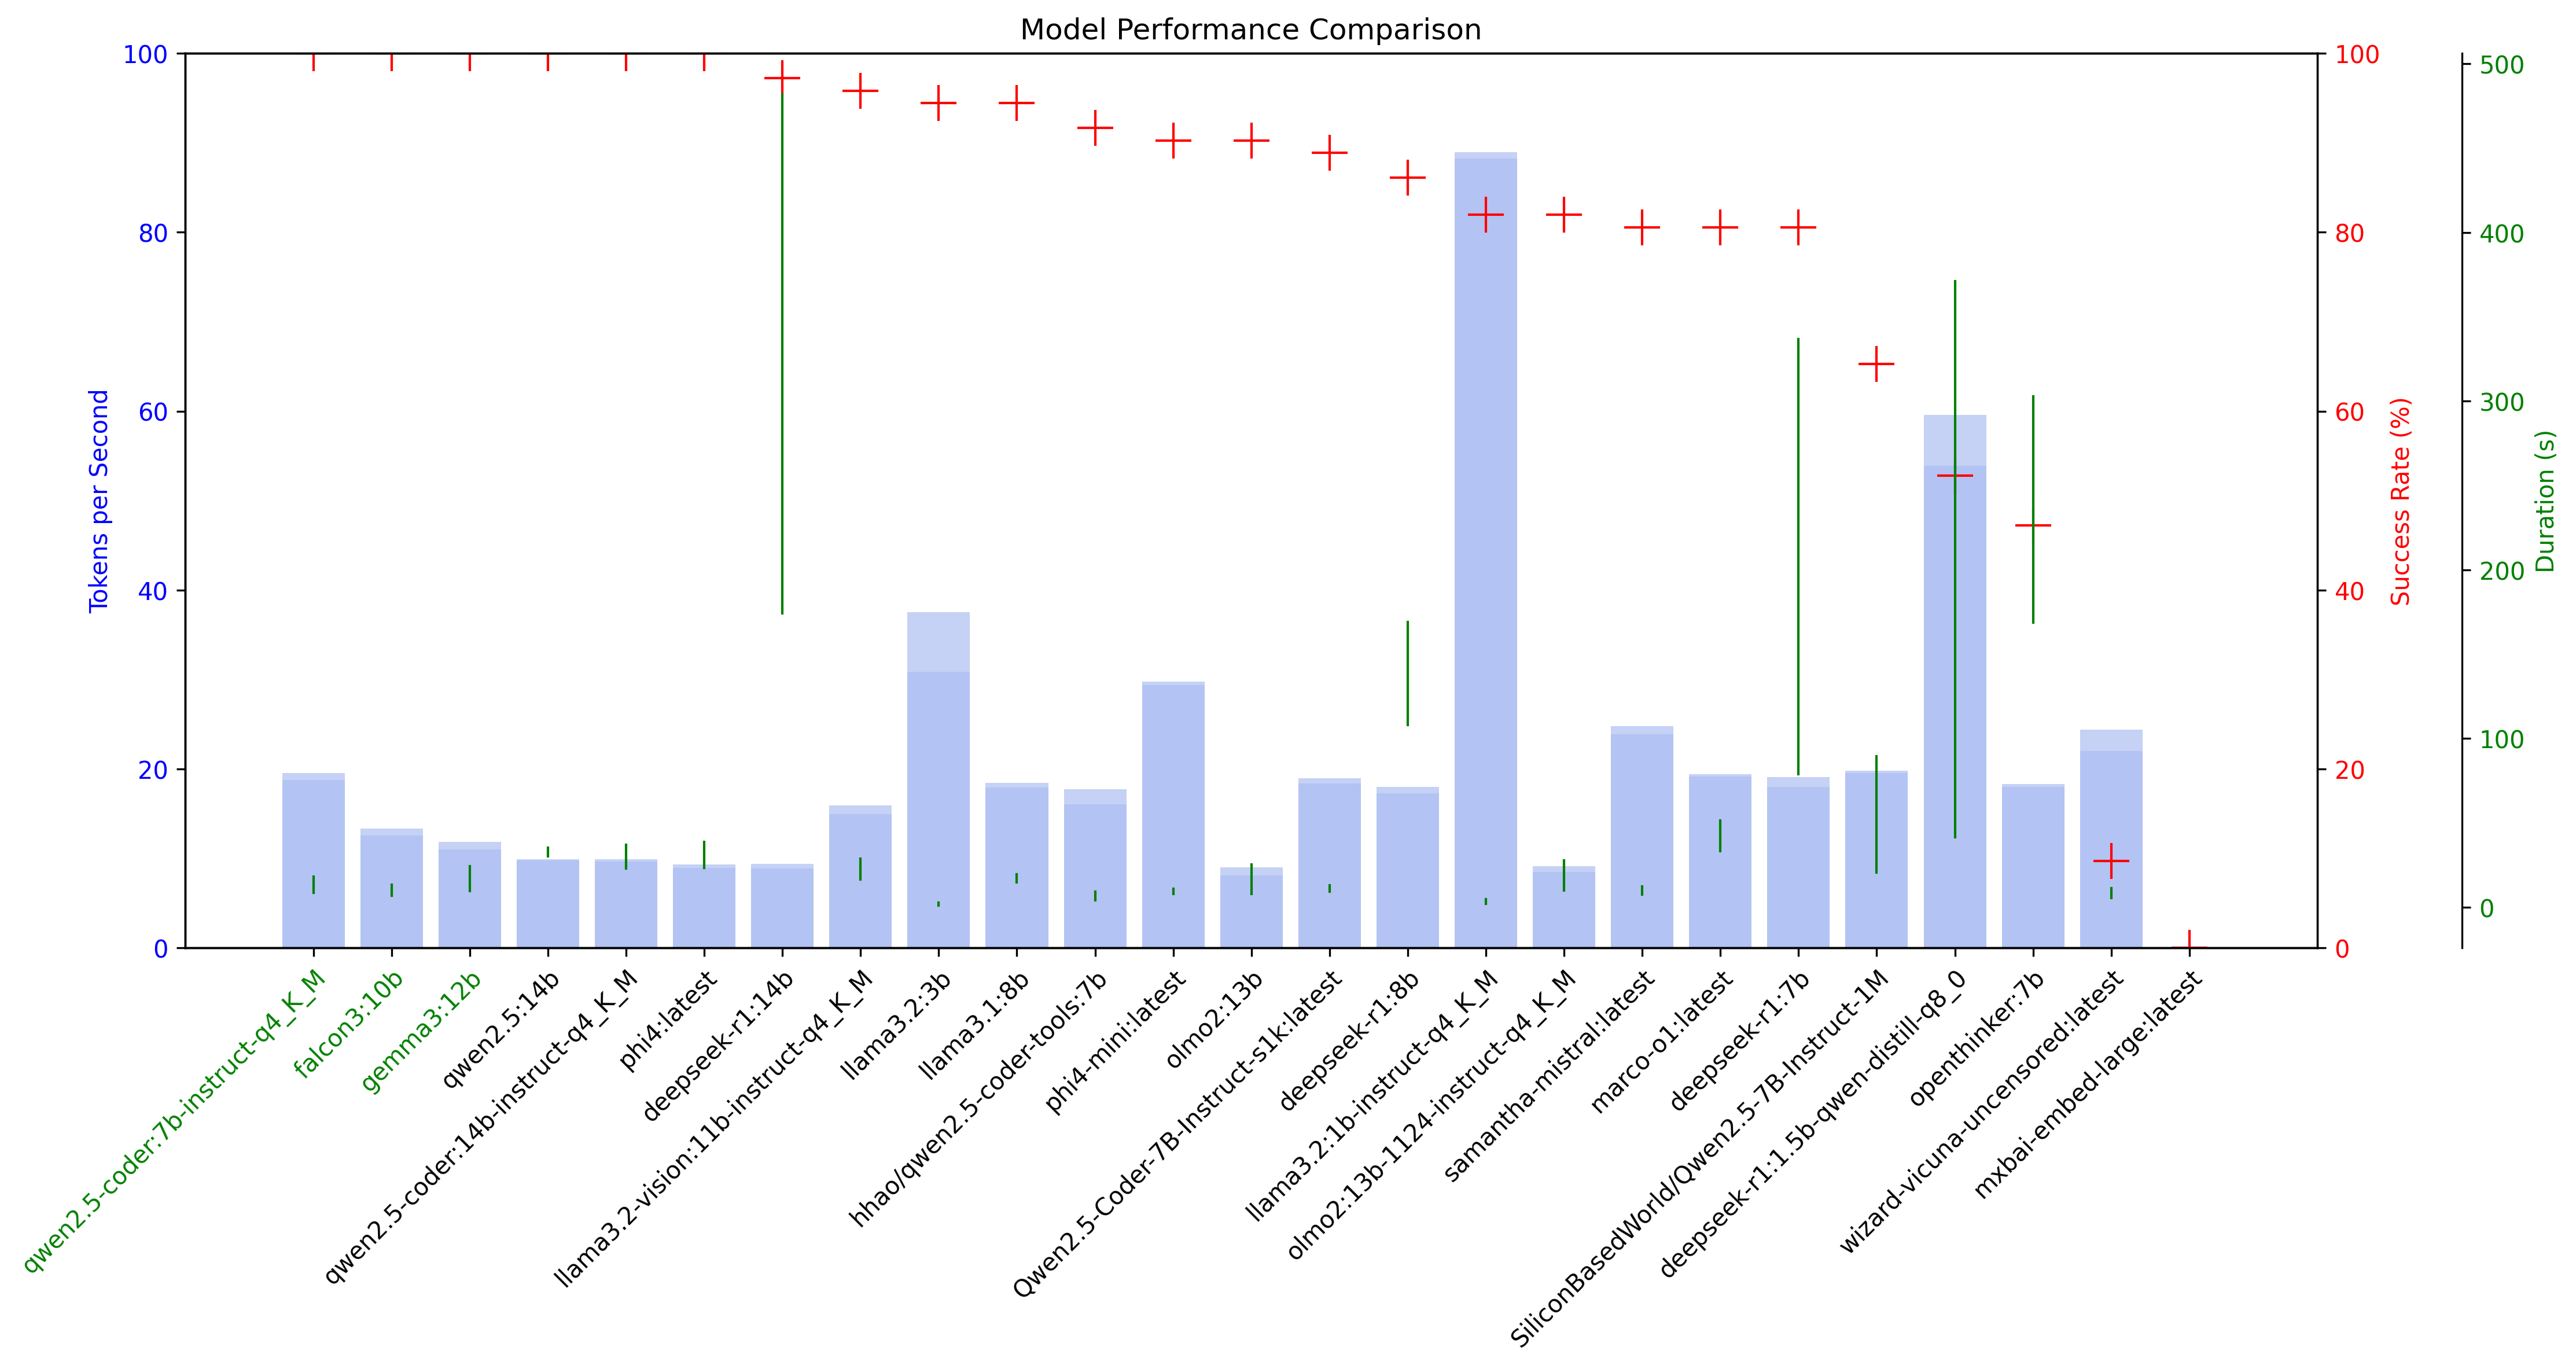
Visualization Features
The visualization includes:
- Model performance comparison
- Token processing speeds with min/max ranges
- Success rates across all tests
- Execution duration ranges
- Color-coded model names (green for high performers)
Model Performance Overview
The best models achieve 100% accuracy, maximize tokens per second (tk/sec), and minimize answer duration. For example, the deepseek-R1 and derived models often provides overly verbose responses, which can affect its overall performance.
Improvements
GPU Information display
- Model Name: DeepSeek
- GPU Used: Apple M1 Pro
- Performance Metrics: The model achieves high accuracy with optimal tk/sec, but its verbosity can lead to longer response times.
Server Configuration
Default servers are configured in the code:
- Local: http://localhost:11434
- Remote: http://192.168.196.60:11434
Example Output
🏆 Final Model Leaderboard:

codellama:13b
   Overall Success Rate: 95.8% (23/24 cases)
   Average Tokens/sec: 145.23
   Average Duration: 2.34s
   Test Results:
   - Fibonacci: ✅ 6/6 cases (100.0%)
   - Binary Search: ✅ 6/6 cases (100.0%)
Output Files
The tool generates several output files in the benchmark_results directory:
-
JSON Results File:
[CPU_Model]_[Server_Address].json- Contains detailed benchmark results for all tested models
- Used for later analysis and visualization
-
Log File:
[CPU_Model]_[Server_Address].log- Contains console output from the benchmark run
- Useful for debugging and reviewing test details
-
Plot Image:
model_comparison.png- High-resolution (300 DPI) visualization of model performance
- Shows token processing speed, success rates, and duration ranges
Function Calling (Tools) Compatibility
The tool now includes a feature to check which Ollama models support function calling (tools). This is useful for identifying models that can be used with applications requiring function calling capabilities.
# Check all models for function calling compatibility
python3 main.py --funcall all

# Check a specific model
python3 main.py --funcall mistral:7b
Example output:
Tools Compatibility Report
===================================================================
Model                                             Tools Support
-------------------------------------------------------------------
qwen2.5:14b                                       ✅ Supported
phi4-mini:latest                                  ✅ Supported
phi4:latest                                       ❌ Not Supported
mistral:7b                                        ✅ Supported
llama3.2:3b                                       ✅ Supported
llama3.2:1b-instruct-q4_K_M                       ✅ Supported
gemma3:12b                                        ❌ Not Supported
===================================================================
During benchmarking, the tool will now also display whether each model supports function calling before running the tests.
Recent Updates
March 2025 Updates
- Added
--plot-onlyoption to skip benchmarking and directly generate plots - Added
--no-plotoption to run benchmarks without generating plots - Added
--fileoption to specify a benchmark results file for plotting - Fixed plot generation to ensure high-quality output images
- Improved visualization with better formatting and higher resolution
- Updated documentation with comprehensive usage instructions
Troubleshooting
Common Issues
-
Ollama Server Connection
- Ensure your Ollama server is running and accessible
- Check the server URL in the
--serveroption
-
Missing Dependencies
- Run
pip install -r requirements.txtto install all required packages - Ensure matplotlib is properly installed for visualization
- Run
-
Plot Generation
- If plots appear empty, ensure you have the latest version of matplotlib
- Check that the benchmark results file contains valid data
Contributing
Feel free to submit issues and enhancement requests!
License
CC NC BY